Enthalpy concentration diagrams can be used to determine different properties of disolutions such as enthalpy and phase composition, depending on the type of diagram that we have. They are valid for 2 components, that is for binary mixtures, and they are usually plotted as a function of mass fraction of one of them.
The two different cases for which we can use enthalpy concentration diagrams are:
a) For disolutions
b) For liquid-vapour systems
a) For disolutions
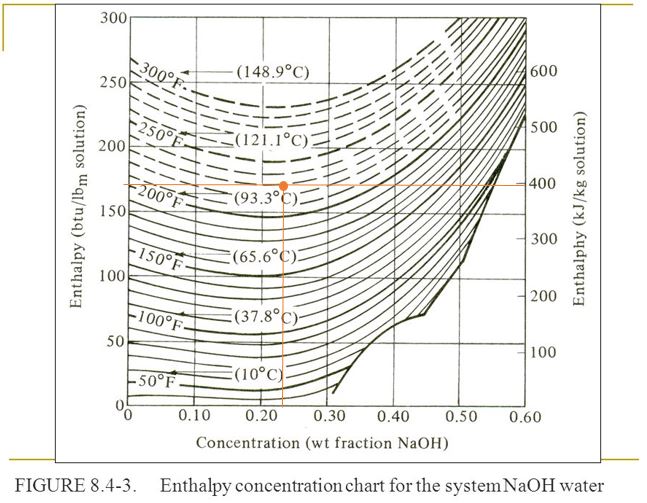
A typical diagram of this type is in the next figure:

The x axis corresponds to the mass fraction of NaOH in a disolution with water as the solvent, while the y axis corresponds to the enthalpy of the disolution. On the left side it is btu/lbm while the right side is for kJ/kg