

We already observed how the Raoult's law functions for ideal systems where the components have a similar molecular weight, size and chemical nature. However, these conditions are not always present to analyze a system. Therefore, it is necessary to study the different deviations from ideality that a mixture can suffer.
Type I : IDEAL BEHAVIOR


|


|
The first case represents the IDEALITY.
We can observe that the activity coefficient is always one, at any pressure or temperature, because there is no need to correct the behavior. On the other hand, the diagram of pressure represents how the pressure of the system behaves and tends to a line, while the concentrations of the components change. In the Txy diagram there are no azeotropes, and it is possible to determine the different dew points and bubble points, depending on the concentration of the most volatile specie. Finally, the xy diagram shows that the most volatile component is present in the vapor phase, so the system is ideal for a separation process like distillation. |
Type II : POSITIVE DEVIATION
|
The first case represents the A POSITIVE DEVIATION.
This means that the repulsive forces are greater than the attraction forces. The deviations of the different curves are above the reference lines, as it can be seen in the pressure diagram. Positive deviation occur when the molecules prefer to be near the molecules of the same nature rather than near molecules of other specie. The activity coefficient in this case is greater than one. We can observe that the activity coefficient changes while the concentration of the most volatile decreases, and it tends to one, as the asymptote. |


|


|
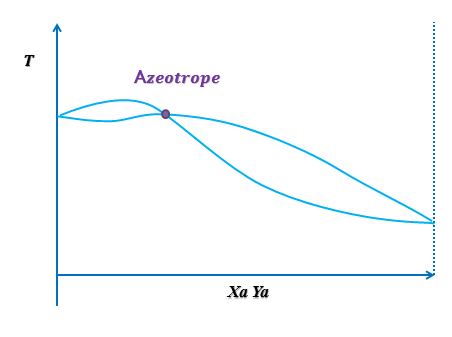
The Txy diagram represents a minimum boiling point azeotrope ( or positive azeotrope) at certain temperature. At this point, the boiling point and the dew point are equal, so it is not possible to separate the components by distillation. The boiling point of the mixture is less or equal than the pure components. This type of azeotrope is the most common.
The left zone of the graphic shows an area where the distillation could be a choice, but the concentration of the most volatile is very small. On the other hand, in the right zone the range of temperature is very small to promote a distillation.
Finally, the xy diagram shows that the most volatile component is not always present in the vapor phase, so the distillation is not a god choice for separate this type of mixture.
Type III : NEGATIVE DEVIATION


|

|
The secondcase represents the A NEGATIVE DEVIATION.
This means that the attraction forces are greater than the repulsive forces. The deviations of the different curves lie down the reference lines, as it can be seen in the pressure diagram. Negative deviation occur when the molecules prefer to be near the molecules of a different nature rather than near themselves. The activity coefficient in this case is less than one. We can observe that the activity coefficient changes while the concentration of the most volatile increases, and it tends to one, as the asymptote. |
The Txy diagram represents a maximum boiling point azeotrope (or negative azeotrope) at certain temperature. At this point, the boiling point and the dew point are equal, so it is not possible to separate the components. Both of the zones showed on this graphic, delimited by the curves; represent an area where the distillation could not happen because of the strict control of the conditions to promote a separation. Also, it is needed a big number of plates, so the column must be large and the energy required represents an extensive use of sources. For these reasons the distillation is not a god choice for separate this type of mixture.
References.
Elliott, J. and Lira, C. (2011). Introductory chemical engineering thermodynamics. 1st ed. [Upper Saddle River, NJ]: Prentice Hall.
Elliott, J. and Lira, C. (2011). Introductory chemical engineering thermodynamics. 1st ed. [Upper Saddle River, NJ]: Prentice Hall.
